| General Statistics |
The User Profile by Regions graph identifies the general location of the visitors to your Web site. The General Statistics table includes statistics on the total activity for this server during the designated time frame.

|
|
| |
| Date & Time This Report was Generated | Sunday November 16, 1997 - 17:38:04 |
| Timeframe | 01/12/96 12:37:55 - 01/25/96 13:37:37 |
| Number of Hits for Home Page | 271 |
| Number of Successful Hits for Entire Site | 3228 |
| Number of Page Impressions | 908 |
| Number of User Sessions | 392 |
| User Sessions from (United States) | 50.25% |
| International User Sessions | 22.44% |
| User Sessions of Unknown Origin | 27.29% |
| Average Number of Hits per Day | 230 |
| Average Number of Page Impressions Per Day | 64 |
| Average Number of User Sessions per Day | 28 |
| Average User Session Length | 00:03:13 |
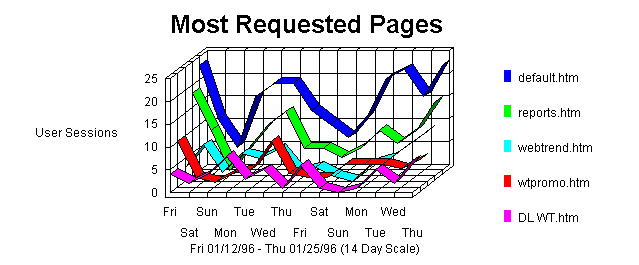
This section identifies the most popular Web Site pages and how often they were accessed. The average time a user spends viewing a page is also indicated in the table.
This section identifies the least popular pages on your Web site, and how often they were accessed.
This section identifies the first page viewed when a user visits this site. This is most likely your home page but, in some cases, it may also be specific URLs that users enter to access a particular page directly.
This section identifies the most common pages users were on when they left your site.
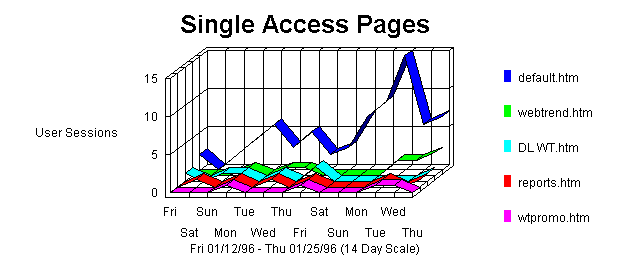
This section identifies the pages on your Web site that visitors access and exit without viewing any other page.
This section identifies the paths people most often follow when visiting your Web site. The path begins at the page of entry and shows the next six consecutive pages viewed.
This section calculates the percentage of ads viewed that were then clicked on (the "Click Thru Rate %"). This information helps gauge the appeal of an advertisement and the quality of the potential customers seeing it.
This section identifies the frequency with which an ad is viewed.
This section identifies the frequency with which viewed ads were clicked on.
This section identifies the most popular file downloads of your Web site. If an error occurred during the transfer, that transfer is not counted.
This section identifies the companies or organizations that accessed your Web site the most often.
This section identifies the top locations of the users of your site by country. The country of the user is determined by the suffix of their domain name.
This section outlines general server activity, comparing the level of activity on weekdays and weekends. Averages in the table do not include erred hits.
This section shows the activity for each day of the week for the report period (i.e. if there are two Mondays in the report period, the value presented is the sum of all hits for both Mondays.) The Total Weekdays line indicates the number of hits occurring Monday through Friday of the report period. The Total Weekends line indicates the number of hits occurring Saturday and Sunday of the report period. Values in the table do not include erred hits.
This section shows the most and the least active hour of the day for the report period. The second table breaks down activity for the given report period to show the average activity for each individual hour of the day.
This table shows the total number of hits for the site, how many were successful, how many failed, and calculates the percentage of hits that failed. It may help you in determining the reliability of your site.
This section identifies the type of errors which were returned by the Client accessing your server.
This section identifies by type the errors which occurred on your server.
This section identifies the download file types and the total kilobytes downloaded for each file type. Cached requests and erred hits are excluded from the totals.
This section provides a breakdown by types of organizations (.com, .net, .edu, .org, .mil, and .gov.) This information can only be displayed if reverse DNS lookups have been performed.
This section breaks down Web site activity to show which of the North American States and Provinces were the most active on your site. This information is based on where the domain name of the visitor is registered, and may not always be an accurate representation of the actual geographic location of this visitor. This information can only be displayed if reverse DNS lookups have been performed.
This section further breaks down your Web site's activity to show which cities were the most active on your site. This information is based on where the domain name of the visitor is registered, and may not always be an accurate representation of the actual geographic location of this visitor. This information can only be displayed if reverse DNS lookups have been performed.
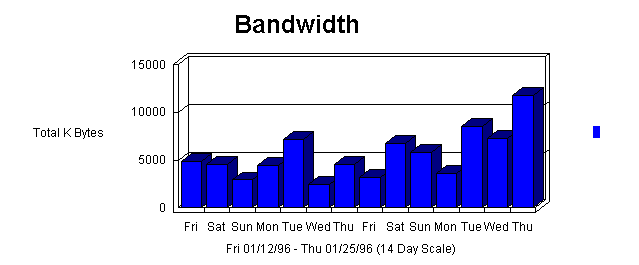
This section helps you understand the bandwidth requirements of your site by indicating the volume of activity as Hits or Kbytes Transferred.
This section analyzes accesses to the directories of your site. This information can be useful in determining the types of data most often requested.
This section identifies the domain names or numeric IP addresses with links to your site. This information will only be displayed if your server is logging this information.
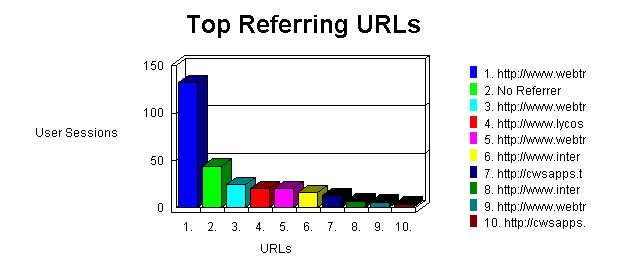
This section provides the full URLs of the sites with links to your site. This information will only be displayed if your server is logging the referrer information.
The first table identifies which search engines referred visitors to your site the most often. Note that each search may contain several keywords. The second table identifies the main keywords for each search engine.
The first table identifies keywords which led the most visitors to your site (regardless of the search engine). The second table identifies, for each keyword, which search engines led visitors to your site.
This section identifies the most popular WWW Browsers used by visitors to your site. This information will only be displayed if your server is logging the browser/platform information.
This section gives you a breakdown of the various versions of Netscape browsers that visitors to your site are using.
This section gives you a breakdown of the various versions of Microsoft Explorer browsers that visitors to your site are using.
This section identifies all robots, spiders, crawlers and search services (i.e. Alta Vista, Lycos, and Excite) visiting your site.
This section identifies the operating systems most used by the visitors to your Web site.
This report was generated by WebTrends.
Most Requested Pages
WebTrends Corporation
http://www.webtrends.com/default.htm271 29.84% 216 00:00:56 302 Moved
http://www.webtrends.com/reports.htm196 21.58% 125 00:00:23 WebTrends
http://www.webtrends.com/webtrend.htm83 9.14% 65 00:01:11 302 Moved
http://www.webtrends.com/wtpromo.htm66 7.26% 62 00:00:42 302 Moved
http://www.webtrends.com/DL_WT.htm57 6.27% 49 00:03:06 302 Moved
http://www.webtrends.com/wtpric.htm51 5.61% 41 00:00:47 How can I order WebTrends?
http://www.webtrends.com/wtorder.htm31 3.41% 29 00:01:10 WebTrends Summary Report
http://www.webtrends.com/general.htm28 3.08% 28 00:00:45 WebTrends Summary Report
http://www.webtrends.com/pages.htm12 1.32% 12 00:00:45 Acme Products Guide
http://www.webtrends.com/refer.htm10 1.1% 10 00:00:26
Sub Total For the Page Views Above
805
88.65%
N/A
N/A
Total For the Log File
908
100%
N/A
N/A
Least Requested Pages
http://www.webtrends.com/serrors.htm1 0.11% 1
http://www.webtrends.com/smrtpric.htm1 0.11% 1
http://www.webtrends.com/berrors.htm1 0.11% 1
http://www.webtrends.com/DL_ADTRK.htm1 0.11% 1
http://www.webtrends.com/DL_WT.HTM.htm1 0.11% 1
http://www.webtrends.com/guest_b.htm1 0.11% 1
http://www.webtrends.com/smrtpass.htm1 0.11% 1
http://www.webtrends.com/ftype.htm2 0.22% 2
http://www.webtrends.com/state.htm2 0.22% 2
http://www.webtrends.com/ctpric.htm2 0.22% 2
Top Entry Pages

WebTrends Corporation
http://www.webtrends.com/default.htm58.62% 170 WebTrends
http://www.webtrends.com/webtrend.htm10% 29 302 Moved
http://www.webtrends.com/reports.htm9.65% 28 302 Moved
http://www.webtrends.com/DL_WT.htm5.17% 15 How can I order WebTrends?
http://www.webtrends.com/wtorder.htm2.75% 8 302 Moved
http://www.webtrends.com/wtpromo.htm2.41% 7 302 Moved
http://www.webtrends.com/wtpric.htm2.06% 6 WebTrends Summary Report
http://www.webtrends.com/general.htm1.37% 4
http://www.webtrends.com/wt_here.txt1.03% 3
http://www.webtrends.com/alerttrk.htm1.03% 3
Total For the Pages Above
94.13%
273
Top Exit Pages
WebTrends Corporation
http://www.webtrends.com/default.htm36.55% 106 WebTrends
http://www.webtrends.com/webtrend.htm11.72% 34 302 Moved
http://www.webtrends.com/DL_WT.htm9.31% 27 302 Moved
http://www.webtrends.com/wtpromo.htm7.58% 22 302 Moved
http://www.webtrends.com/reports.htm7.58% 22 How can I order WebTrends?
http://www.webtrends.com/wtorder.htm5.86% 17 WebTrends Summary Report
http://www.webtrends.com/general.htm3.79% 11 302 Moved
http://www.webtrends.com/wtpric.htm3.44% 10 InterGreat WebTrends FAQ- Marketing and Traffic Reporting for Web Servers
http://www.webtrends.com/wtqa.htm2.41% 7
http://www.webtrends.com/alerttrk.htm1.37% 4
Total For the Pages Above
89.65%
260
Single Access Pages
WebTrends Corporation
http://www.webtrends.com/default.htm65.74% 71 WebTrends
http://www.webtrends.com/webtrend.htm9.25% 10 302 Moved
http://www.webtrends.com/DL_WT.htm6.48% 7 302 Moved
http://www.webtrends.com/reports.htm5.55% 6 302 Moved
http://www.webtrends.com/wtpromo.htm3.7% 4 How can I order WebTrends?
http://www.webtrends.com/wtorder.htm1.85% 2
http://www.webtrends.com/BROWSER.htm0.92% 1 InterGreat WebTrends FAQ- Marketing and Traffic Reporting for Web Servers
http://www.webtrends.com/wtqa.htm0.92% 1 WebTrends Summary Report
http://www.webtrends.com/general.htm0.92% 1 WebTrends Summary Report
http://www.webtrends.com/pages.htm0.92% 1
Total For the Pages Above
96.29%
104
Top Paths Through Site
1. http://www.webtrends.com/default.htm 24.48% 71 1. http://www.webtrends.com/default.htm
2. http://www.webtrends.com/reports.htm
3. http://www.webtrends.com/wtpromo.htm
4. http://www.webtrends.com/wtpric.htm
5. http://www.webtrends.com/wtorder.htm4.13% 12 1. http://www.webtrends.com/default.htm
2. http://www.webtrends.com/reports.htm
3. http://www.webtrends.com/wtpromo.htm3.44% 10 1. http://www.webtrends.com/default.htm
2. http://www.webtrends.com/reports.htm
3. http://www.webtrends.com/webtrend.htm3.44% 10 1. http://www.webtrends.com/webtrend.htm 3.44% 10 1. http://www.webtrends.com/DL_WT.htm 2.41% 7 1. http://www.webtrends.com/reports.htm 2.06% 6 1. http://www.webtrends.com/default.htm
2. http://www.webtrends.com/reports.htm1.72% 5 1. http://www.webtrends.com/reports.htm
2. http://www.webtrends.com/general.htm1.72% 5 1. http://www.webtrends.com/wtpromo.htm 1.37% 4
Total For the Paths Above
48.27%
140
Advertising Views and Clicks
IBM Laptop Ad 122 7 5.73% Microsoft Explorer Ad 29 4 13.79% Netscape Server Ad 9 2 22.22%
Total
160
13
8.12%
Advertising Views
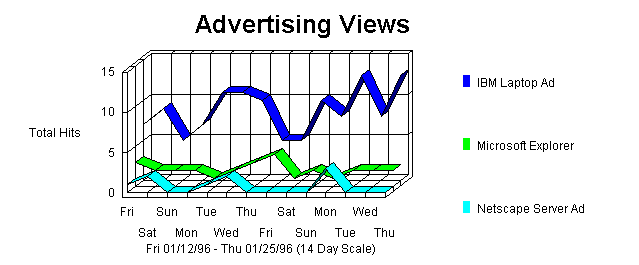
IBM Laptop Ad 122 76.25% 114 Microsoft Explorer Ad 29 18.12% 29 Netscape Server Ad 9 5.62% 9
Total
160
100%
N/A
Advertising Clicks
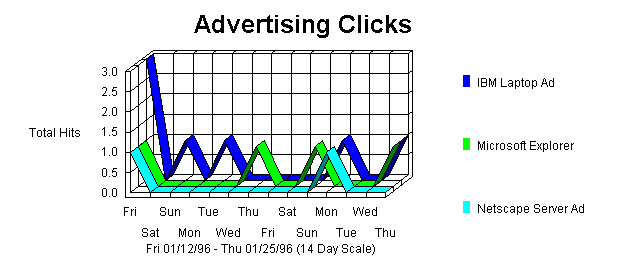
IBM Laptop Ad 7 53.84% 7 Microsoft Explorer Ad 4 30.76% 4 Netscape Server Ad 2 15.38% 2
Total
13
100%
N/A
Most Downloaded Files

http://www.webtrends.com/download/wt_trial.exe 52 96.29% 46 http://www.webtrends.com/download/pingit.zip 2 3.7% 2
Total For the Files Above
54
100%
N/A
Most Active Organizations
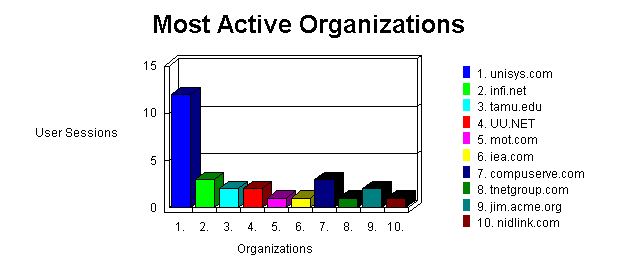
Unisys Corp.
unisys.com52 1.61% 12 Infinet L.c.
infi.net51 1.57% 3 Toshiba America Medical Systems Inc.
tamu.edu35 1.08% 2 Uunet Technologies Inc.
UU.NET34 1.05% 2 Motorola Inc.
mot.com32 0.99% 1 Computech
iea.com31 0.96% 1 Compuserve Incorporated
compuserve.com29 0.89% 3 TeleNet
tnetgroup.com29 0.89% 1 Jim Smith (President)
jim.acme.org28 0.86% 2 NetLink Inc.
nidlink.com27 0.83% 1
Subtotal For Companies Above
348
10.78%
28
Total For the Log File
3228
100%
392
Most Active Countries

United States 197 Canada 17 UK 14 Germany 10 Sweden 5 Australia 4 Norway 3 Thailand 3 Russian Federation 3 France 3 Malaysia 2 Israel 2 Italy 2 Brazil 2 Netherlands 2
Total
269
Summary of Activity by Day
Average Number of Users per day on Weekdays
31
Average Number of Hits per day on Weekdays
260
Average Number of Users for the entire Weekend
36
Average Number of Hits for the entire Weekend
311
Most Active Day of the Week
Thu
Least Active Day of the Week
Sat
Most Active Day Ever
January 25, 1996
Number of Hits on Most Active Day
498
Least Active Day Ever
January 20, 1996
Number of Hits on Least Active Day
113
Activity Level by Day of Week
Sun 327 10.13% 39 Mon 411 12.73% 56 Tue 492 15.24% 67 Wed 528 16.35% 70 Thu 712 22.05% 72 Fri 462 14.31% 54 Sat 296 9.16% 34
Total Weekdays
2605
80.7%
319
Total Weekend
623
19.29%
73
Activity Level by Hour of the Day

Most Active Hour of the Day
13:00-13:59
Least Active Hour of the Day
22:00-22:59
00:00-00:59 38 1.17% 7 01:00-01:59 90 2.78% 15 02:00-02:59 54 1.67% 8 03:00-03:59 37 1.14% 14 04:00-04:59 72 2.23% 9 05:00-05:59 101 3.12% 14 06:00-06:59 175 5.42% 15 07:00-07:59 243 7.52% 30 08:00-08:59 89 2.75% 14 09:00-09:59 189 5.85% 20 10:00-10:59 123 3.81% 17 11:00-11:59 215 6.66% 24 12:00-12:59 328 10.16% 43 13:00-13:59 365 11.3% 37 14:00-14:59 179 5.54% 17 15:00-15:59 58 1.79% 8 16:00-16:59 131 4.05% 21 17:00-17:59 96 2.97% 8 18:00-18:59 125 3.87% 15 19:00-19:59 109 3.37% 9 20:00-20:59 156 4.83% 20 21:00-21:59 159 4.92% 18 22:00-22:59 29 0.89% 2 23:00-23:59 67 2.07% 7
Total Users during Work Hours (8:00am-5:00pm)
1677
51.95%
201
Total Users during After Hours (5:01pm-7:59am)
1551
48.04%
191
Technical Statistics and Analysis
Total Hits
3236
Successful Hits
3228
Failed Hits
8
Failed Hits as Percent
0.24%
Cached Hits
131
Cached Hits as Percent
4.04%
Client Errors

000 Incomplete / Undefined 8 80% 404 Page or File Not Found 2 20%
Total
10
100%
Server Errors
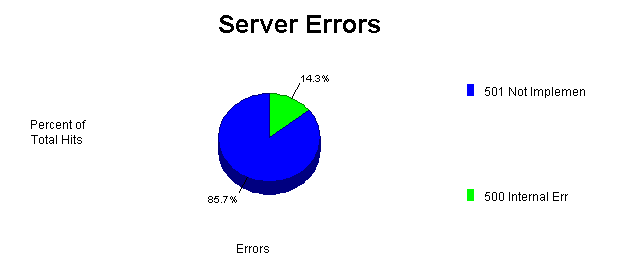
501 Not Implemented 36 85.71% 500 Internal Error 6 14.28%
Total
42
100%
Most Downloaded File Types and Sizes

*.gif 2128 8,699K *.htm 896 3,918K *.exe 52 64,929K *.PL 13 167K *.txt 6 14K *.zip 2 11K
Total Hits & K Bytes Transferred
3097
77,735K
Organization Breakdown
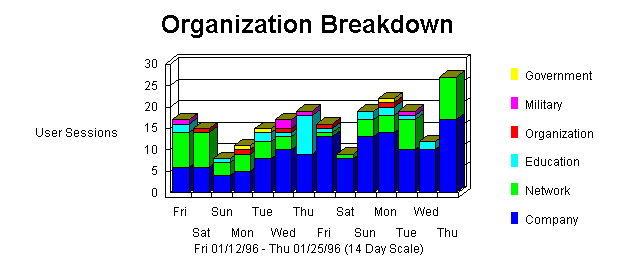
Company 1181 57.75% 133 Network 567 27.72% 57 Education 179 8.75% 23 Organization 65 3.17% 5 Military 37 1.8% 5 Government 16 0.78% 3
Total
2045
100%
226
North American States and Provinces

California 34 Pennsylvania 17 Virginia 14 New York 12 Florida 11 Massachusetts 10 Texas 8 Oregon 7 Ohio 6 Colorado 4
Total
123
Most Active Cities
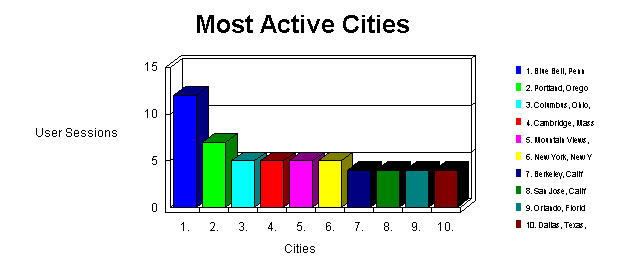
Blue Bell, Pennsylvania, United States 12 Portland, Oregon, United States 7 Columbus, Ohio, United States 5 Cambridge, Massachusetts, United States 5 Mountain Views, California, United States 5 New York, New York, United States 5 Berkeley, California, United States 4 San Jose, California, United States 4 Orlando, Florida, United States 4 Dallas, Texas, United States 4
Total
55
Bandwidth
Most Accessed Directories
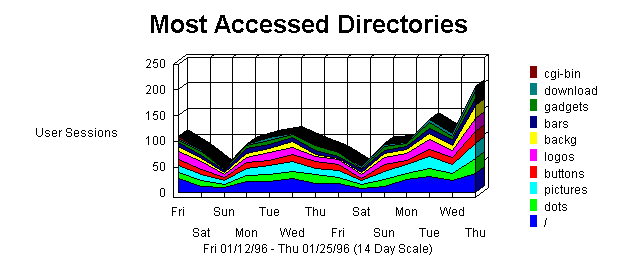
http://www.webtrends.com/ 1031 31.93% 99.41% 4,856K 293 http://www.webtrends.com/dots 748 23.17% 89.83% 636K 194 http://www.webtrends.com/pictures 480 14.86% 98.75% 4,415K 214 http://www.webtrends.com/buttons 322 9.97% 92.54% 62K 165 http://www.webtrends.com/logos 253 7.83% 100% 1,420K 191 http://www.webtrends.com/backg 117 3.62% 100% 494K 115 http://www.webtrends.com/bars 111 3.43% 90.99% 740K 111 http://www.webtrends.com/gadgets 99 3.06% 90.9% 11K 98 http://www.webtrends.com/download 54 1.67% 100% 64,940K 47 http://www.webtrends.com/cgi-bin 13 0.4% 100% 167K 11
Top Referring Sites
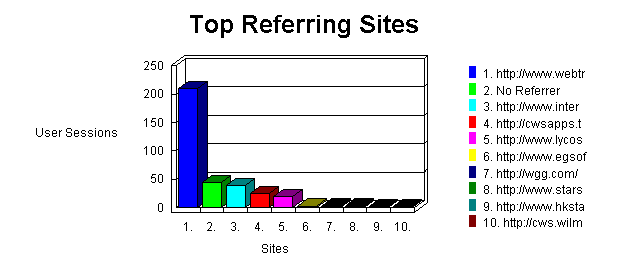
http://www.webtrends.com/ 210 No Referrer 44 http://www.intergreat.com/ 39 http://cwsapps.texas.net/ 25 http://www.lycos.com/ 20 http://www.egsoftware.com/ 3 http://wgg.com/ 3 http://www.stars.com/ 3 http://www.hkstar.com/ 2 http://cws.wilmington.net/ 2 file:///C|/WEBROOT/SVRSTATS/COMPLETE.HTM 2 http://www.yahoo.com/ 2 http://nwsobu.wh.att.com/ 2 file:///C|/DATFILES/REPORTS/LASTRPT.HTM 2 http://guide-p.infoseek.com/ 2 http://search.yahoo.com/ 2 http://www.pi.net/ 1 http://caboose.com/ 1 http://www.internet.no/ 1 http://www.wlyn.com/ 1
Sub Total for the Referring Sites Above
367
Total for the Log File
392
Top Referring URLs
Top Search Engines
Yahoo 12 75% InfoSeek 4 25%
Total of Searches for the Engines Above
16
100%
Total of Searches for the Log File
16
100%
Yahoo trends 10 62.5% internet 10 62.5% webtrend 2 12.5% InfoSeek webtrends 3 18.75% webtrend 1 6.25%
Top Search Keywords
trends 10 38.46% internet 10 38.46% webtrends 3 11.53% webtrend 3 11.53%
Total Found for the Keywords Above
26
100%
Total of Keywords Found in the Log File
26
100%
trends Yahoo 10 38.46% internet Yahoo 10 38.46% webtrends InfoSeek 3 11.53% webtrend Yahoo 2 7.69% InfoSeek 1 3.84%
Most Used Browsers

Netscape 2881 89.25% 342 Microsoft Internet Explorer 192 5.94% 24 NCSA Mosaic 37 1.14% 3 Spry AIR Mosaic 20 0.61% 2 SpyGlass Mosaic 19 0.58% 1 Lycos Robot 17 0.52% 2 IBM WebExplorer 15 0.46% 1 SurfBot 12 0.37% 1 Scooter/1.0 scooter@pa.dec.com 10 0.3% 2 GNNworks 5 0.15% 4
Total
3208
99.38%
382
Netscape Browsers
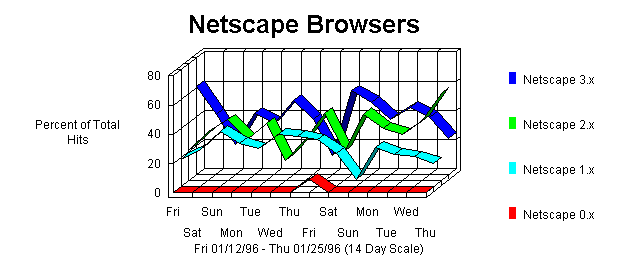
Netscape 3.x 1106 38.38% 131 Netscape 2.x 1064 36.93% 136 Netscape 1.x 694 24.08% 74 Netscape 0.x 17 0.59% 1
Total
2881
100%
342
Microsoft Explorer Browsers
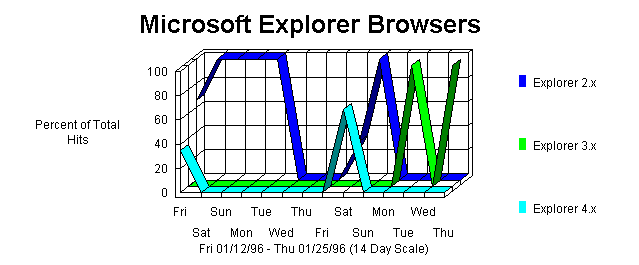
Explorer 2.x 110 57.29% 15 Explorer 3.x 50 26.04% 7 Explorer 4.x 32 16.66% 2
Total
192
100%
24
Visiting Spiders

Lycos Robot 17 50% 2 SurfBot 12 35.29% 1 Wobot 4 11.76% 3 ArchitextSpider 1 2.94% 1
Total
34
100%
7
Most Used Platforms
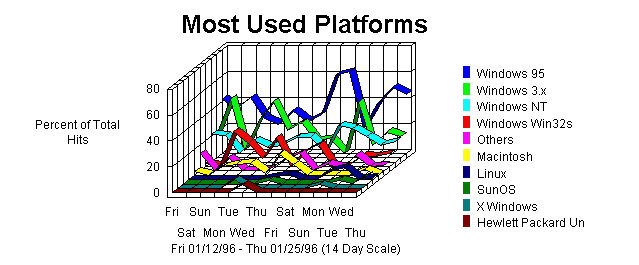
Windows 95 1234 38.22% 149 Windows 3.x 710 21.99% 81 Windows NT 567 17.56% 76 Windows Win32s 277 8.58% 25 Others 177 5.48% 33 Macintosh 120 3.71% 11 Linux 58 1.79% 5 SunOS 47 1.45% 9 X Windows 21 0.65% 2 Hewlett Packard Unix (HP9000) 17 0.52% 1
Total
3228
100%
392 ![[WebTrends Corporation]](wtlogoss.gif)